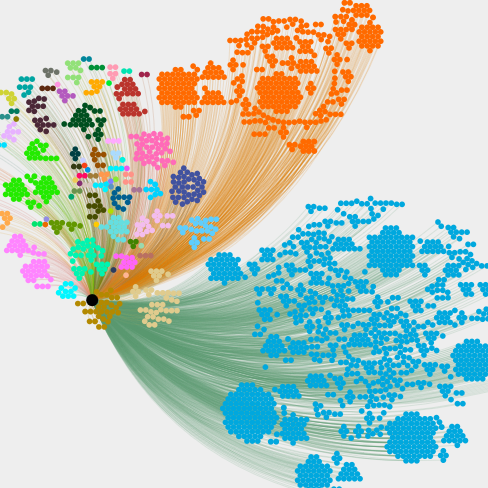
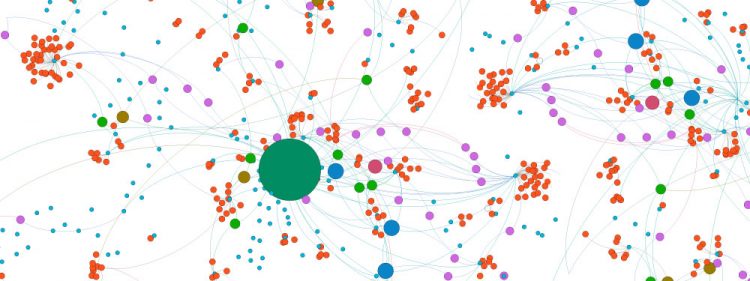
I’ve been doing some “First Defence” analysis of the Two Up firewall. I was trying to work out the best way to visualise the data. I started with Pie Charts, then Bar Graphs. Whilst this was good for representing the larger chunks of data (Country, mostly), standard 2-D graphing meant the smaller parts were inconveniently […]

