I have recently revisited ways to visualise large, and complex data sets. As well as “traditional data”, I’ve ventured into “Social Graphing” too. This is the process of analysing data from Social Networks, and joining the dots to visualise links and interactions. This incredibly intricate data can be quickly assessed and categorised, highlighting areas of interest. Such tools have been used to coordinate aid missions during disasters.
By default, Twitter makes your “Followers”, “Following” and “Likes” data fully public. With the right tools, you can query this data, and then carry out the process on each of your followers, and their followers. You can continue mining data all the way down the rabbit-hole. The only limitation (for “consumer grade” access) is time. Twitter “rate limit” access to the data. However, these requests are hugely scriptable. In this case, i used a Raspberry Pi and Python to do exactly that, and it took roughly 4 days to collect data. I mostly followed this excellent guide on medium.com by Luca Hammer (@luca).
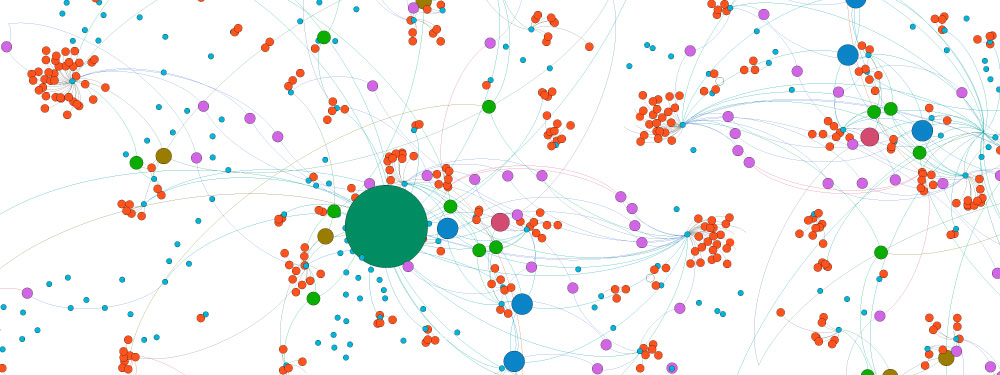
Once I had my data sets, I imported them into Gephi, which I used to analyse the data to find similarities. The standard settings in Gephi are fine for many things, but you really need a decent system if you are analysing huge datasets, and you should tweak Gephi’s performance settings. I shall do a post on that, and link it here later. In the latest release of Gephi (0.9.1), you can interface direct into the Twitter API to watch the network in real-time.
I set out on this project intending to cover the entire UK political spectrum. Unfortunately, some of the main political leaders have made their data unavailable to the general public which makes things a little bit more difficult.
You can view this, and other Gephi/SigmaJS projects on our playground.
0 Comments Leave a comment
Comments are closed.